
Electrician Density by State: Business Competition & Opportunity
Where should an electrical contractor expand? A good starting point is to compare business locations per resident, workforce concentration, and where demand comes from. A large population doesn't guarantee an open market, and lots of small shops don't automatically mean too much competition.
This 2025 edition uses the BLS Quarterly Census of Employment and Wages (QCEW) for establishment and employment figures, plus Census population estimates. Every state has published data, so no BurSignal estimates were needed. Housing growth and permit data add context.
Where should an electrical business expand?
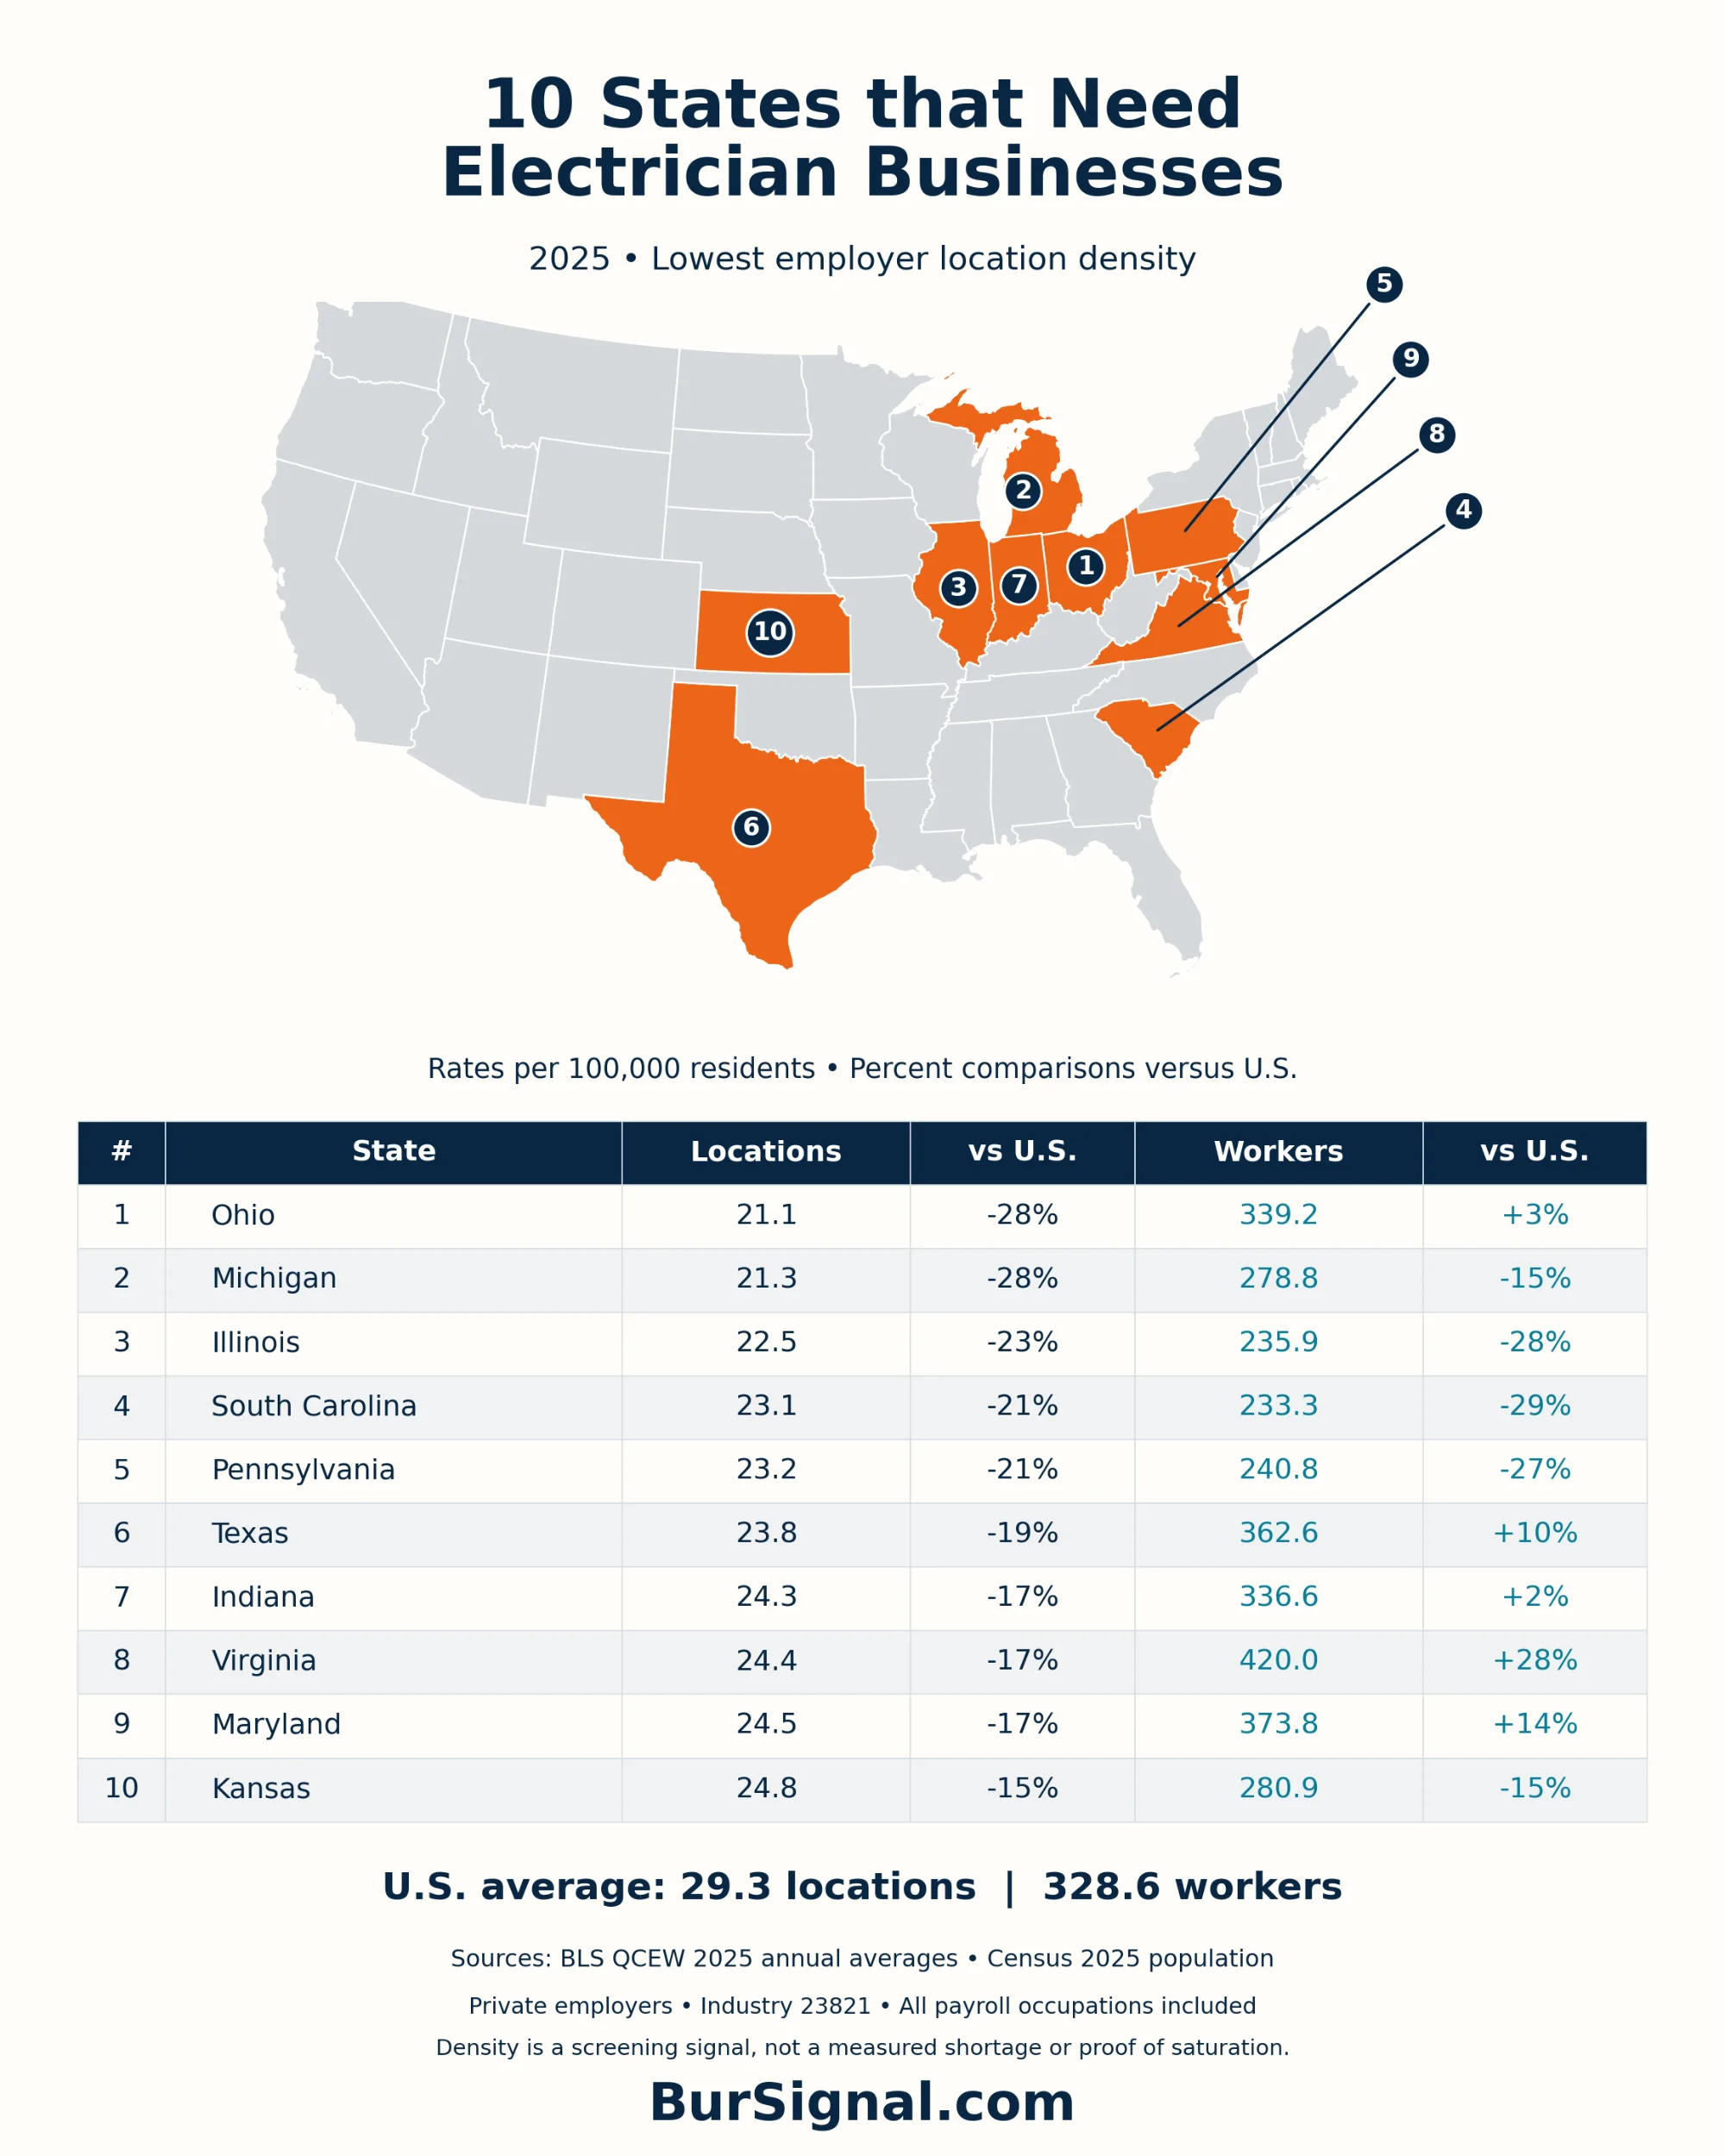
For a first pass, here are the ten states with the fewest private electrical contracting locations per 100,000 residents in 2025. Ohio, Michigan, and Illinois top the list. These are places worth investigating, not a verified list of states with unmet demand.
- Ohio: 21.1 locations per 100k (28% below the US average), 339.2 workers per 100k (3% above)
- Michigan: 21.3 locations (-28%), 278.8 workers (-15%)
- Illinois: 22.5 locations (-23%), 235.9 workers (-28%)
- South Carolina: 23.1 locations (-21%), 233.3 workers (-29%)
- Pennsylvania: 23.2 locations (-21%), 240.8 workers (-27%)
- Texas: 23.8 locations (-19%), 362.6 workers (+10%)
- Indiana: 24.3 locations (-17%), 336.6 workers (+2%)
- Virginia: 24.4 locations (-17%), 420.0 workers (+28%)
- Maryland: 24.5 locations (-17%), 373.8 workers (+14%)
- Kansas: 24.8 locations (-15%), 280.9 workers (-15%)
Virginia and Maryland show the opportunity hypothesis most clearly. Both have 17% fewer locations per resident than average, but workforce density is 28% and 14% above average. Texas has 19% fewer locations and 10% more workers. Ohio pairs low location density with slightly above-average workforce density.
Tennessee ranks 13th-lowest, with 26.2 locations and 317.4 workers per 100,000 residents. Fewer locations alongside solid employment suggests larger businesses. It doesn't necessarily mean workers are available to hire or that demand is going unmet.
What does "electrician density" mean?
"Electrician density by state" can mean several things. This analysis looks at business locations and the people employed there. It does not count individual electrical licenses.
Business Locations
Workforce
Avg. Location Size
Three ways to measure electrician density
Business location density
An establishment is generally one business at one location. A company with one shop and 20 employees usually counts as one establishment; a company with three branches can count as three. QCEW annual counts average four quarterly counts, so they aren't a count of every business active at any point during the year.
The industry is BLS code 23821, Electrical and Wiring Contractors. It includes both residential (238211) and nonresidential (238212) electrical contractors.
Workforce density
Workforce density divides average annual industry employment by resident population. It includes electricians, helpers, office staff, managers, and other payroll roles. An electrician employed directly by a factory or utility may be counted in a different industry.
Average location size
Dividing employees by locations shows how the workforce is spread out. A state with many locations but an average-sized workforce has smaller shops on average. This helps explain how a market is structured, but it isn't a measure of typical crew size.
The national benchmark
The 2025 QCEW national private-industry totals are 100,285 establishments and average annual employment of 1,123,060. Divided by the 2025 population of 341,784,857 (50 states plus DC), that gives these benchmarks:
- Locations per 100,000 residents: 29.3
- Payroll workers per 100,000 residents: 328.6
- Employees per location: 11.2
Each state is compared to this population-weighted national rate. A state that's 50% above average has about 1.5 times as many locations per resident as the nation overall. That doesn't mean 50% more competition in every town.
Other business indicators to consider
Density describes the market as it stands today. An expansion decision also needs evidence about which way demand is heading. Housing growth, permits, sales, and construction activity help tell a growing market apart from one with an inflated pipeline.
Housing Growth
Permits
Sales
Reading the demand pipeline, step by step
Start with recent housing growth
Housing-unit growth measures the change in the number of homes, including apartments. It's useful for spotting growing service markets, but it's a net figure, not a count of new construction jobs. By the time a home shows up in the housing count, most of the initial electrical work may already be done.
Census Vintage 2025 data shows U.S. housing stock grew 1.0% between July 2024 and July 2025. Idaho led at 2.1%, followed by Arizona at 2.0% and South Carolina at 1.9%.
South Carolina deserves a closer look: it combines low location and workforce density with fast housing growth. Idaho shows that high business density can coexist with ongoing construction opportunity. Neither pattern alone proves a shortage.
Use permits to examine the pipeline
The Census Building Permits Survey tracks housing units approved for new private residential construction at the state and local level. For a current read, compare the latest year-to-date numbers with the same months last year, look at single-family and multifamily separately, and check both growth rates and total volume. Permits signal a pipeline; they don't guarantee work will start.
Where local records exist, permit applications and planning approvals can give an even earlier view. Keep applications, approvals, starts, and completions separate.
Watch the gap between permits and sales
If permits rise while new-home sales weaken and unsold inventory piles up, builders may delay starts, cut subcontractor spending, or offer more concessions. If sales keep up with new supply while permits hold steady, the case for continued work is stronger.
Don't just subtract total permits from total home sales. Apartment permits are often rental projects, and existing-home sales aren't new construction. Compare single-family permits with new single-family sales over the same periods and areas, and allow for time lags. Census sales estimates are only national and regional, so state-level analysis needs another source.
A growing housing stock, an active permit pipeline, and healthy sales together make a stronger case than any one signal. Renovation, commercial, and industrial work should be considered separately, because residential permits don't capture them.
Ten states with the most electrical contractor locations
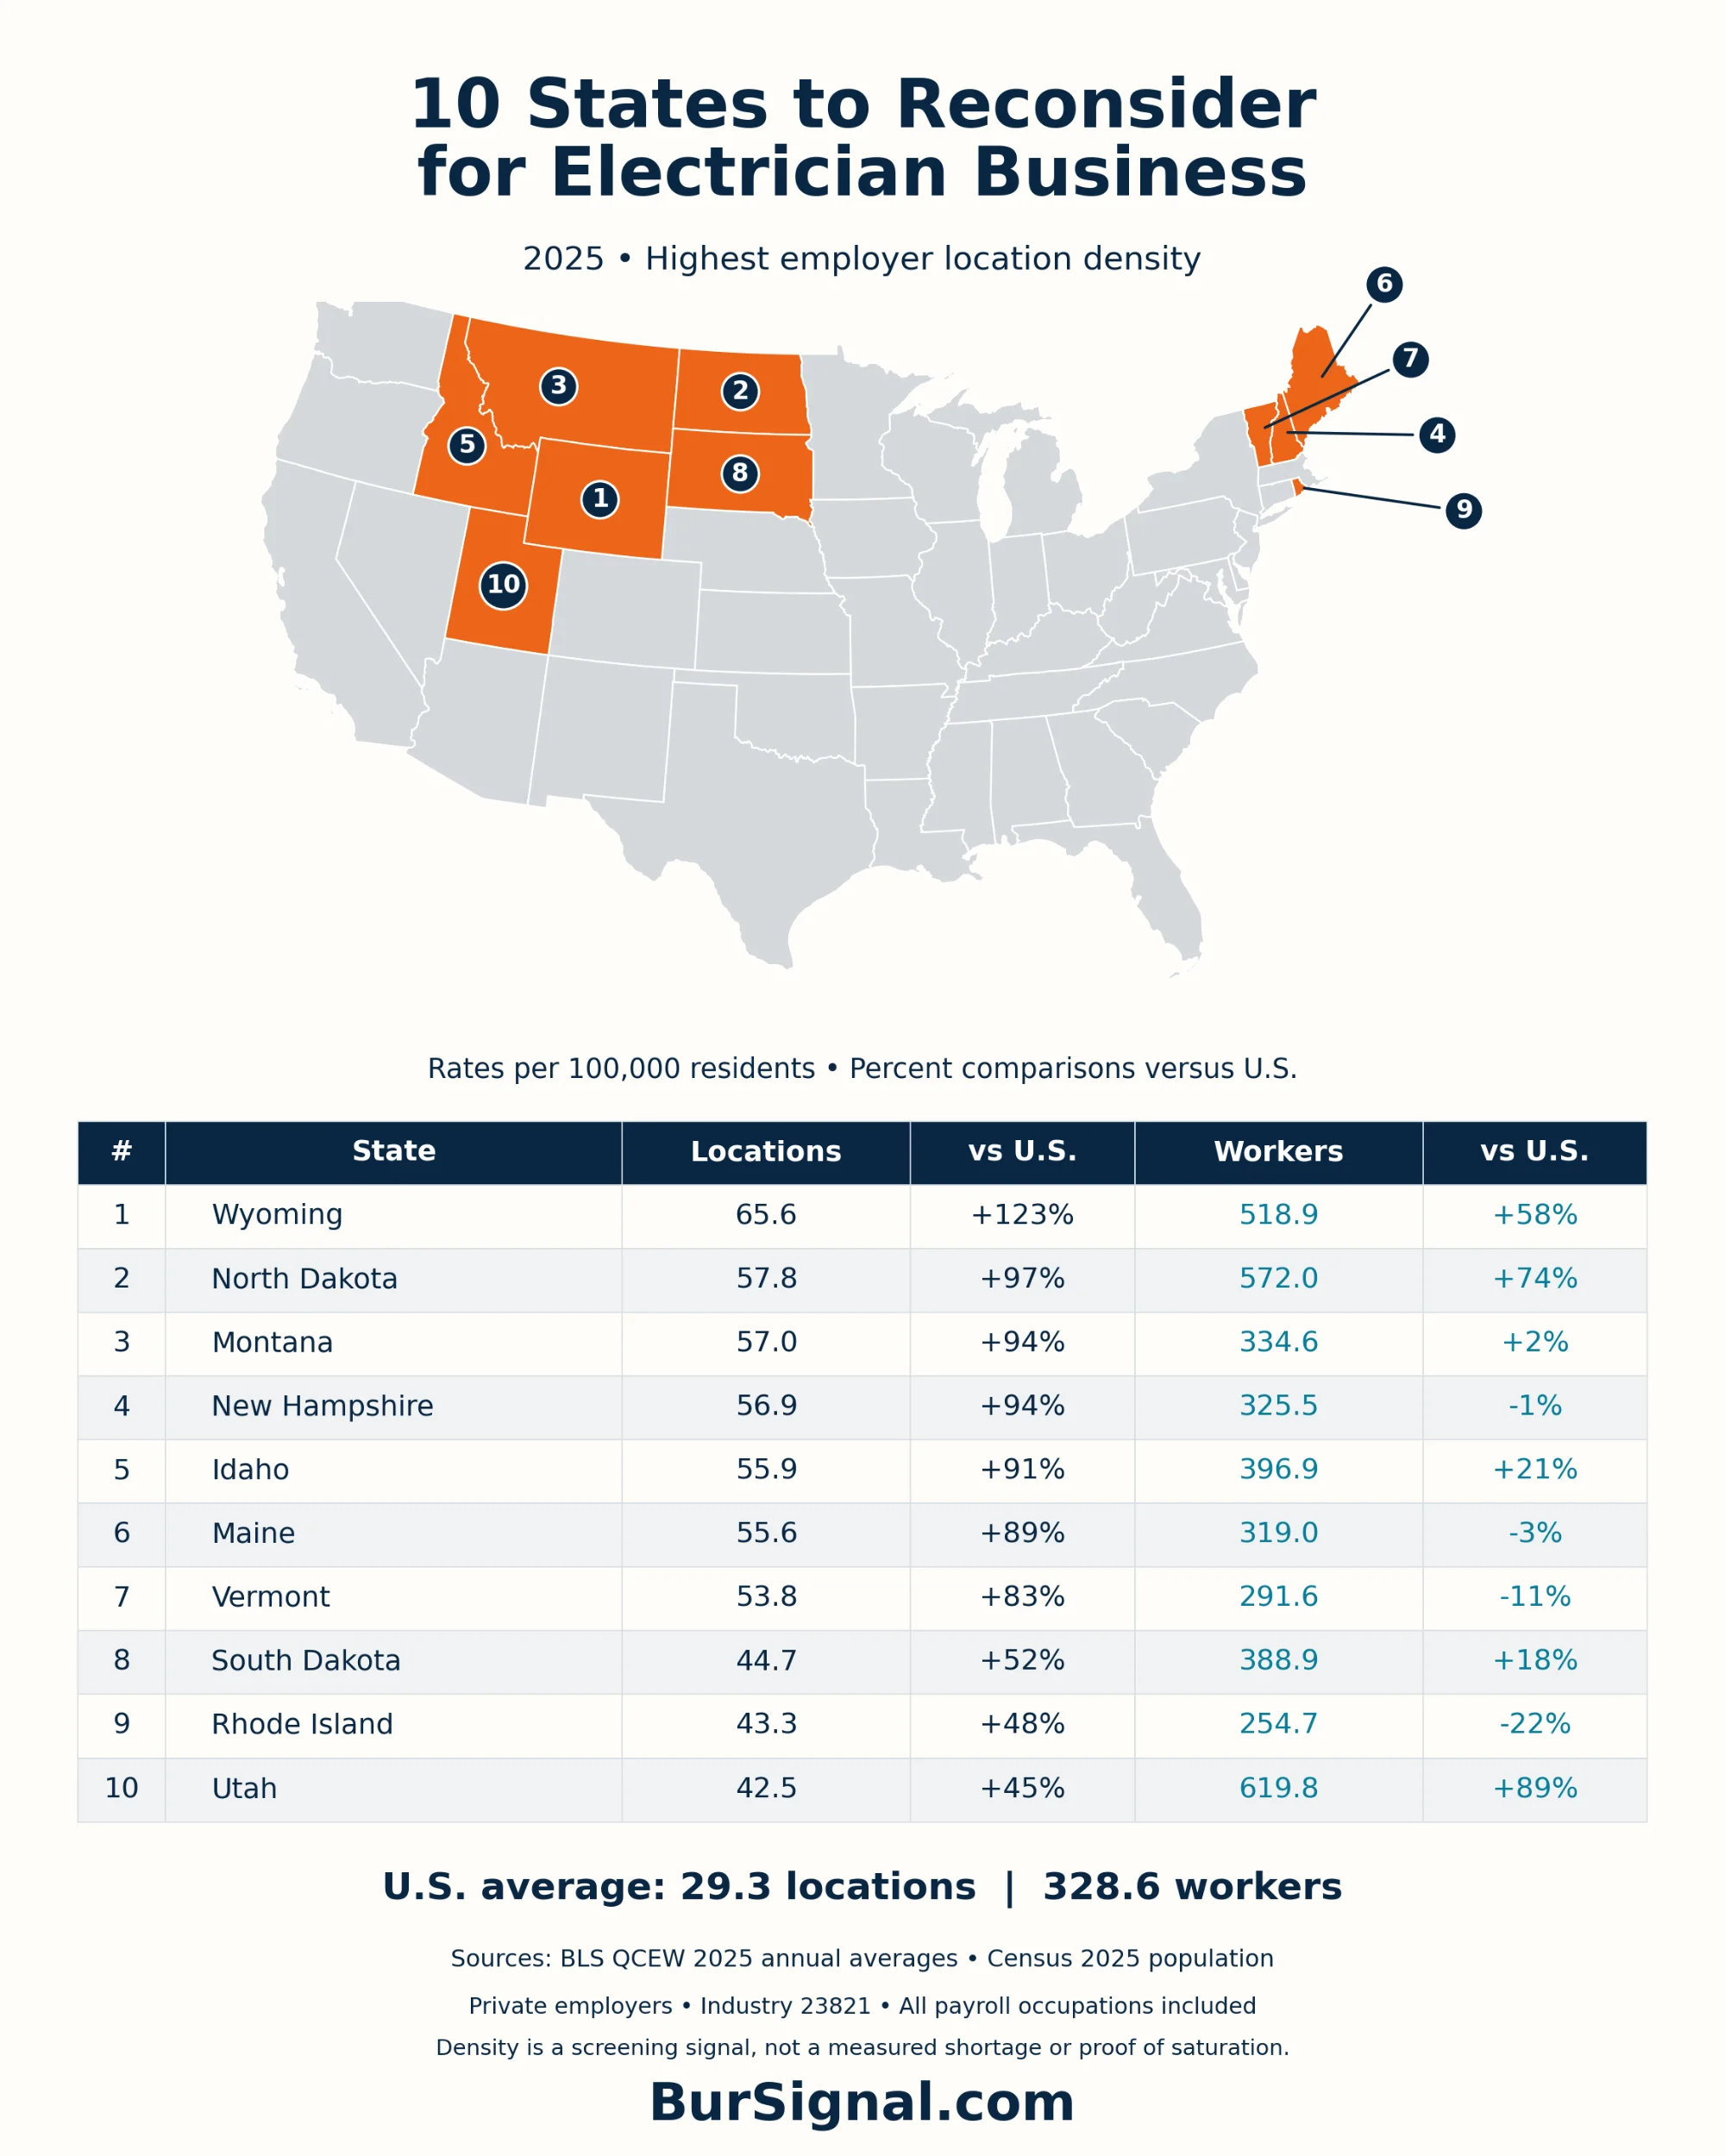
The ten highest-density states in 2025 are Wyoming, North Dakota, Montana, New Hampshire, Idaho, Maine, Vermont, South Dakota, Rhode Island, and Utah.
- Wyoming: 65.6 locations per 100k (+123% vs US average), 518.9 workers per 100k (+58%)
- North Dakota: 57.8 locations (+97%), 572.0 workers (+74%)
- Montana: 57.0 locations (+94%), 334.6 workers (+2%)
- New Hampshire: 56.9 locations (+94%), 325.5 workers (-1%)
- Idaho: 55.9 locations (+91%), 396.9 workers (+21%)
- Maine: 55.6 locations (+89%), 319.0 workers (-3%)
- Vermont: 53.8 locations (+83%), 291.6 workers (-11%)
- South Dakota: 44.7 locations (+52%), 388.9 workers (+18%)
- Rhode Island: 43.3 locations (+48%), 254.7 workers (-22%)
- Utah: 42.5 locations (+45%), 619.8 workers (+89%)
Montana and New Hampshire have 94% more locations per resident than average, but near-average worker density. Vermont has 83% more locations but 11% fewer workers; Rhode Island has 48% more locations but 22% fewer workers. These states have many smaller shops, not an unusually large workforce. Utah is the opposite: 45% more locations but 89% more workers.
A new business may run into more local competitors in these states. But some shops serve specialized customers, remote communities, or seasonal properties, and this data can't show how directly they compete. High density is a reason to research a market, not a reason to rule it out.
Why high business density doesn't always mean a crowded market
Spread-out communities can support smaller local shops
Most of the high-density states average fewer employees per location than the national 11.2. Montana averages 5.9, New Hampshire 5.7, and Vermont 5.4. Long travel distances may make centralized service costly, which could help explain more, smaller local shops. That's an interpretation, not a proven cause.
It isn't only about rural areas, though. Rhode Island also has high density and small shops, while Utah's average location is larger than normal at 14.6 workers.
Seasonal properties add work without adding residents
Census identifies Maine, New Hampshire, and Vermont as longtime leaders in vacation-home share. Those properties still need repairs and upgrades, even though their owners are counted as residents somewhere else. Measuring per resident can understate how many properties these businesses actually serve.
Energy and industry create demand beyond households
North Dakota is the clearest example. Its energy economy includes oil production, gas facilities, and power generation serving markets outside the state. North Dakota Commerce ties electrician demand directly to construction, infrastructure, and energy, and local contractors describe Bakken work on compressor stations, motors, drives, instrumentation, and maintenance. Wyoming's large energy sector suggests a similar mix of industrial and household demand.
Construction growth and older buildings create different opportunities
Montana's labor department links construction growth to migration and residential demand, especially in western Montana. Idaho's labor department documents population-driven construction growth, and South Dakota reported specialty trades leading construction job growth in 2023.
Utah's housing stock grew 12.9% from 2020 to 2025, compared with 5.5% nationally, which helps explain its very high workforce density. Rhode Island's housing plan points to old buildings and repair needs, a likely source of renovation work alongside its small-shop structure.
The opportunity question
One useful hypothesis: relatively few locations alongside a substantial workforce may leave room for another well-positioned local business. Google names relevance, distance, and popularity as factors in local search results, which supports the value of local positioning, though it doesn't mean a new location will outrank established competitors.
For a state-level screen, look at business density and workforce density together, then ask what's driving demand. The gap between the two is informative; what causes it determines how useful it is for expansion.
Methodology and limitations
BurSignal calculated these rankings from published 2025 BLS QCEW annual-average data for industry 23821, private ownership, all establishment sizes, statewide records. Population figures are July 1, 2025 Census Vintage 2025 estimates.
Calculations
- Business density = employer establishments ÷ resident population × 100,000
- Worker density = industry payroll employees ÷ resident population × 100,000
- Employees per location = payroll employees ÷ employer establishments
- Difference from US average = (state density ÷ national density − 1) × 100
Rankings cover the 50 states; national benchmarks include DC. Territories are excluded. Percentages were calculated before rounding.
Note on the earlier edition: the previous version of this article used 2023 Census County Business Patterns data. This edition uses 2025 BLS QCEW, which differs in coverage and methods. Changes between the two editions should not be read as growth from 2023 to 2025.
What this data can and can't tell you
- Establishments are locations, not necessarily separate companies, Google Business Profiles, or licensed contractors.
- Workers include everyone employed in the industry, not just trained electricians.
- Businesses with no paid employees (sole proprietors) are excluded, so this isn't a complete count of competitors.
- Population is a common yardstick, not a full demand model. Seasonal homes, industrial sites, and cross-border work all affect the picture.
- State averages hide big differences between cities and counties.
- These figures don't measure job openings, customer wait times, profitability, or a verified electrician shortage.
The lowest-density states are places to investigate, not guaranteed best states to start an electrical business.
Get more detailed local research
Want to go beyond statewide averages? Subscribe to BurSignal for updates on ZIP-code-level research, local business density, construction activity, and other signals that can help you narrow down your next market. State rankings show where to start looking; local data helps explain what opportunity is actually there.
Sources
- U.S. Bureau of Labor Statistics: QCEW overview
- U.S. Bureau of Labor Statistics: 2025 QCEW annual files
- U.S. Census Bureau: Vintage 2025 population estimates
- Google Business Profile Help: Tips to improve your local ranking
- U.S. Census Bureau: Vintage 2025 cities and housing release
- U.S. Census Bureau: Building Permits Survey
- U.S. Census Bureau: Relationships among construction measures
- U.S. Census Bureau: New Residential Sales
- U.S. Census Bureau: Historical Census of Housing Tables, Vacation Homes
- North Dakota State Government: Energy and Natural Resources
- North Dakota Commerce: Closing the Skills Gap
- Triangle Electric: Industrial Oil and Gas Services
- U.S. Energy Information Administration: Wyoming overview
- Montana Department of Labor and Industry: Construction Sector Analysis
- Idaho Department of Labor: Labor Market and Economic Report 2024
- South Dakota Department of Labor: Nonfarm Worker Trends in 2023
- Idaho Office of the Governor: Housing unit growth in 2025
- Rhode Island Statewide Planning: Housing 2030
- U.S. Bureau of Labor Statistics: QCEW industry codes and titles
- U.S. Census Bureau: Nonemployer Statistics
- U.S. Bureau of Labor Statistics: Employment and Wages Annual Averages 2025
- U.S. Bureau of Economic Analysis: Employment and wage measure differences